Category: front page profile

  • Polka dots, patches and pinstripes? Productive pasture patterns

    Polka dots, patches and pinstripes? Productive pasture patterns

    Do I need to apologise for the overly alliterative title? The excessive use of P’s aside, this title is still ridiculous, who has seen a polka dot pasture? Or a pinstripey paddock? They sound like a figment of Dr. Seuss’ imagination!

    But they’re not, it’s science – an ingenious recipe, mixing landscape design, with a pinch of ecology, and a tablespoon of agriculture. Let’s get cooking!

    When did we (and by we I mean the human race/ Homo sapiens/ mankind/ womankind/ humanity/ Earthlings), when did we decide that livestock grazing pastures were to be squares of fenced grass? It was probably somewhere around 12,000 years ago when we stopped being nomadic and started agricultural farming.

    Fenced grass pastures work, they have been working for thousands of years. But times they are a’changing (insert a “back in my day…” quote here). The human population (no more we’s, it’s getting serious now) has swelled into the billions (8,286,120,266 at the time of writing), requiring massive agricultural landscape expansion to sustain us.

    There is no better example of this than where I live; the Canterbury Plains of Aotearoa New Zealand. Less than 0.5% of Canterbury Plains’ native bushland has survived the ever-expanding agricultural and residential landscapes. This is where we run into our big pinch of ecology – if we were to put the native plants and animals back, where would they go?

    The answer – into polka dots, patches and pinstripes.

    I’ll explain what the patterns are about, as I know you’ve been waiting patiently. They are landscape design patterns of native woody plants within an agricultural livestock pastural setting. They are the answer – cohabitation of native habitats and productive farming, all within one landscape.

    Lincoln University‘s multi-disciplinary researchers, James Eggers, Shannon Davis, Crile Doscher and Pablo Gregorini, are the large brains behind this pioneering conceptual design. In their study, they list ideal native woody plant species that can be used to both enhance livestock welfare and restore bush habitats for native birds.

    Now we’re cooking with renewable energy, and we’re baking three cakes in one pan – through increasing foraging opportunities for livestock, providing shade and shelter for these livestock, and establishing native bird sanctuaries. Wow!

    Picture this – you’re a farmer and this is your Canterbury Plains farm. Nice, right! You have multiple grass paddocks where you graze sheep and cattle. In reality, this is Lincoln University’s Ashley Dene Farm which was used as a case study for this research, but in this virtual Blog, it’s yours.

    Figure 1: Aerial view of Ashley Dene Farm Image © 2023 by J. Eggers et. al. Licensee MDPI, Basel, Switzerland. CC-BY 4.0

    Let’s say you want to increase foraging opportunities for your livestock. You know that foraging woody vegetation has long been recognised as beneficial. Woody vegetation tolerates poor soils and weather conditions. It provides a range of nutrients and medicinal properties for optimal livestock health. Also, a diversity of forage enhances livestock consumption and can lengthen the grazing season. Finally, foraging allows livestock to exhibit natural browsing behaviour, thereby boosting welfare.

    Lucky for you, thanks to this research, we have a list of optimal foraging native shrubs and small trees (shorter plants for livestock access) selected for palatability, tolerance for browsing and growth rate. Now for the fun part – how to arrange these plants. We have three patterns…

    Polka dots (or patches): vary in size and are placed within pastures. The central area is fenced to prevent overgrazing and to accommodate natural seedling regeneration.

    Figure 2: Polkadots. Image © 2023 by J. Eggers et. al. Licensee MDPI, Basel, Switzerland. CC-BY 4.0

    Spreading: balances access to forage, preventing over browsing through the use of a central fenced off strip. It preserves maximal grazing pasture by running along pre-existing fence lines. Livestock can be moved between paddocks/sides of the spreading forage to allow for regeneration on one side whilst the other is browsed.

    Figure 3: Spreading. Image © 2023 by J. Eggers et. al. Licensee MDPI, Basel, Switzerland. CC-BY 4.0

    Pinstripes (or just stripes): maximises foraging opportunities and is compatible with farming that uses large machinery. The stripes are within a single paddock, placed 40 m apart for optimal browsing, and temporary fencing is used to designate/restrict feeding areas.

    Figure 4: Stripes. Image © 2023 by J. Eggers et. al. Licensee MDPI, Basel, Switzerland. CC-BY 4.0

    Back to your hypothetical farm, you now have an amazing amount of native forage for your livestock. However, with your farm being on the Canterbury Plains, it is constantly hounded by northeasterly, hot northwesterly, and cold southwesterly winds. Your animals need shelter. Shade and shelter for livestock reduces heat/cold stress, excess moisture loss, improves animal wellbeing, increases feed intake and lamb survival rate.

    Here is a native solution with multiple benefits, no more English hedgerows that provide little to no food for wildlife. Native trees and dense shrubs are selected for their height, shade, canopy, and provision of shelter. Unlike the foraging designs, these shelter patterns are fully fenced off to allow for optimal plant growth without the pressure of grazing.

    Straight shelter: a pretty straight-forward design (see what I did there) providing shelter in areas of limited space.

    Figure 5: Straight shelter. Image © 2023 by J. Eggers et. al. Licensee MDPI, Basel, Switzerland. CC-BY 4.0

    Meandering shelter: similar to the straight design, however, with a greater width to act as a wildlife corridor and habitat.

    Figure 6: Meandering shelter. Image © 2023 by J. Eggers et. al. Licensee MDPI, Basel, Switzerland. CC-BY 4.0

    In-paddock shade trees: taller trees are placed through paddocks, in groups or individually, to provide shade. There is no underplanting to allow for a cooling breeze.

    Figure 7: In-paddock shade trees. Image © 2023 by J. Eggers et. al. Licensee MDPI, Basel, Switzerland. CC-BY 4.0

    Ah, that’s nice. Now your sheep and cattle are well fed and comfortable. The productive capacity of your farm is in order. But, you also care deeply about native wildlife and want to do everything you can to protect them (but not with a loss of productivity for your farm). Is this possible? Well, let’s see…

    James and his team designed native bird bush habitats around a wetland corridor, an area of pre-existing mature trees, and a densely planted area. Densely planting native bushland are better at dealing with edge effects, reducing the distance that light and sound pollution can travel into the patch, and increasing bushland’s suitability for sensitive birds (like kererū). The mature trees act as nurse species for the native seedlings and the wetlands will breed waterborne insects – an additional snack for many bird species.

    Whilst the forage and shelter plantings were determined by the needs and landscape of the farm, placement of bush habitats required consideration of the wider landscape. Preference was given to the native bird habitat locations as they had specific requirements. Native bird habitats must connect to a wider established ecological network for birds to be able to travel to the site (within 5-25km distance dependent on the bird species). Amazingly, native bird abundance can almost quadruple with the addition of restored bushland to agricultural landscapes. This research identified ultimate native plants that provide bird food sources and nesting sites.

    Figure 8: A comparison of your farm with and without native woody vegetation additions in a combination of design patterns for livestock forage, shade and shelter and native bird bush habitats. Image © 2023 by J. Eggers et. al. Licensee MDPI, Basel, Switzerland. CC-BY 4.0

    So now you have an ideal farm! It balances livestock productivity and native bird habitats through adding an abundance and variety of native plants (an increase of 30% woody vegetation in the case study farm). And yes, there may be a reduction in the grazing land area, but, this is offset by increased forage vegetation, combined with fallen organic matter improving soil health and productivity. The addition of native bird habitats will likely have little impact on farming operations.

    Forage patterns can be integrated into shelter patterns to maximise land use for grazing. Likewise, forage plantings can be placed next to bush habitats to create multifunctional areas. Shelter and forage plantings can complement the bush habitats, by acting as wildlife corridors, edge habitats, and increase plant species diversity. Your imagination is the limit when it comes to combining and implementing the design patterns, however, site specifications, soil types, climate conditions, livestock density, paddock use, and wildlife reserve proximity need to be considered… so maybe your imagination isn’t the limit, as every farming landscape has different specifications.

    We are achieving an agricultural ecological landscape in one location, with broader ecosystem benefits. Restoring and integrating native habitats into farming practice can encourage others to follow, and together we can support the revival of native birds to our currently fragmented landscape. This research kneads together two strong cultural identities of Aotearoa New Zealand – its rich farming history and outstanding natural biodiversity – fortifying and concentrating both.

    As these Patches, Polka dots, and Pinstripes do sound like a Dr. Seuss story, it is only appropriate to end with,

    “Unless someone like you cares a whole awful lot,

    nothing is going to get better.

    It’s not.” – Dr. Seuss’ The Lorax

    So thanks to all of you reading this, farmers or not, I know that you care a whole awful lot.

    This article was prepared by Klara Royster, Master of International Nature Conservation student, for an assignment in ECOL608 Research Methods in Ecology.

    Reference Research Journal Article: Eggers, J., Davis, S., Doscher, C., Gregorini, P. (2023). Enhancing Multifunctionality in Agricultural Landscapes with Native Woody Vegetation. Sustainability Journal, 15, 11295.

  • It’s not you, it’s your species: Mate choice in fishing spiders

    It’s not you, it’s your species: Mate choice in fishing spiders

    Dating is hard and confusing for most… but especially for these guys.

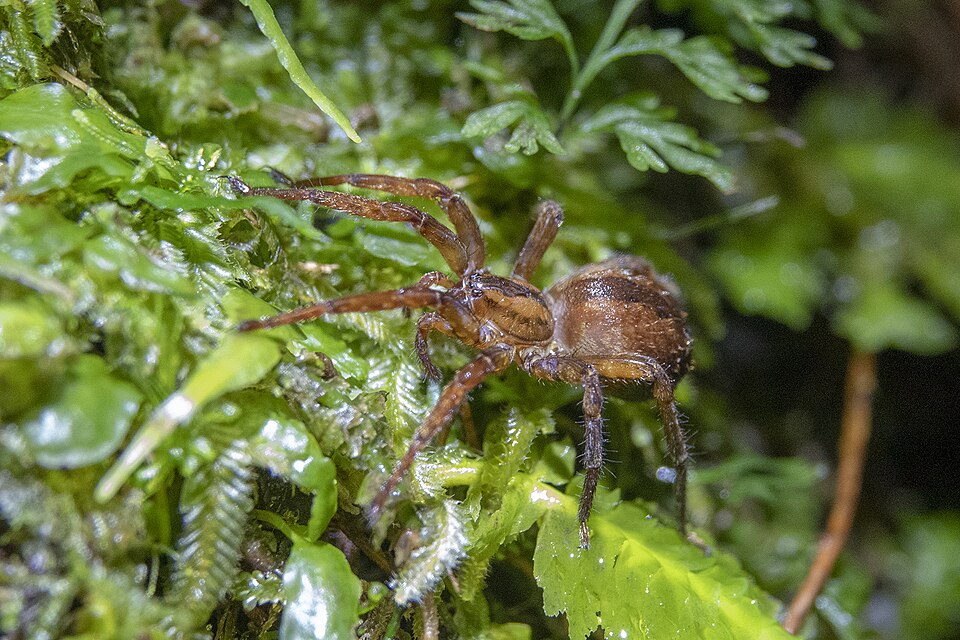
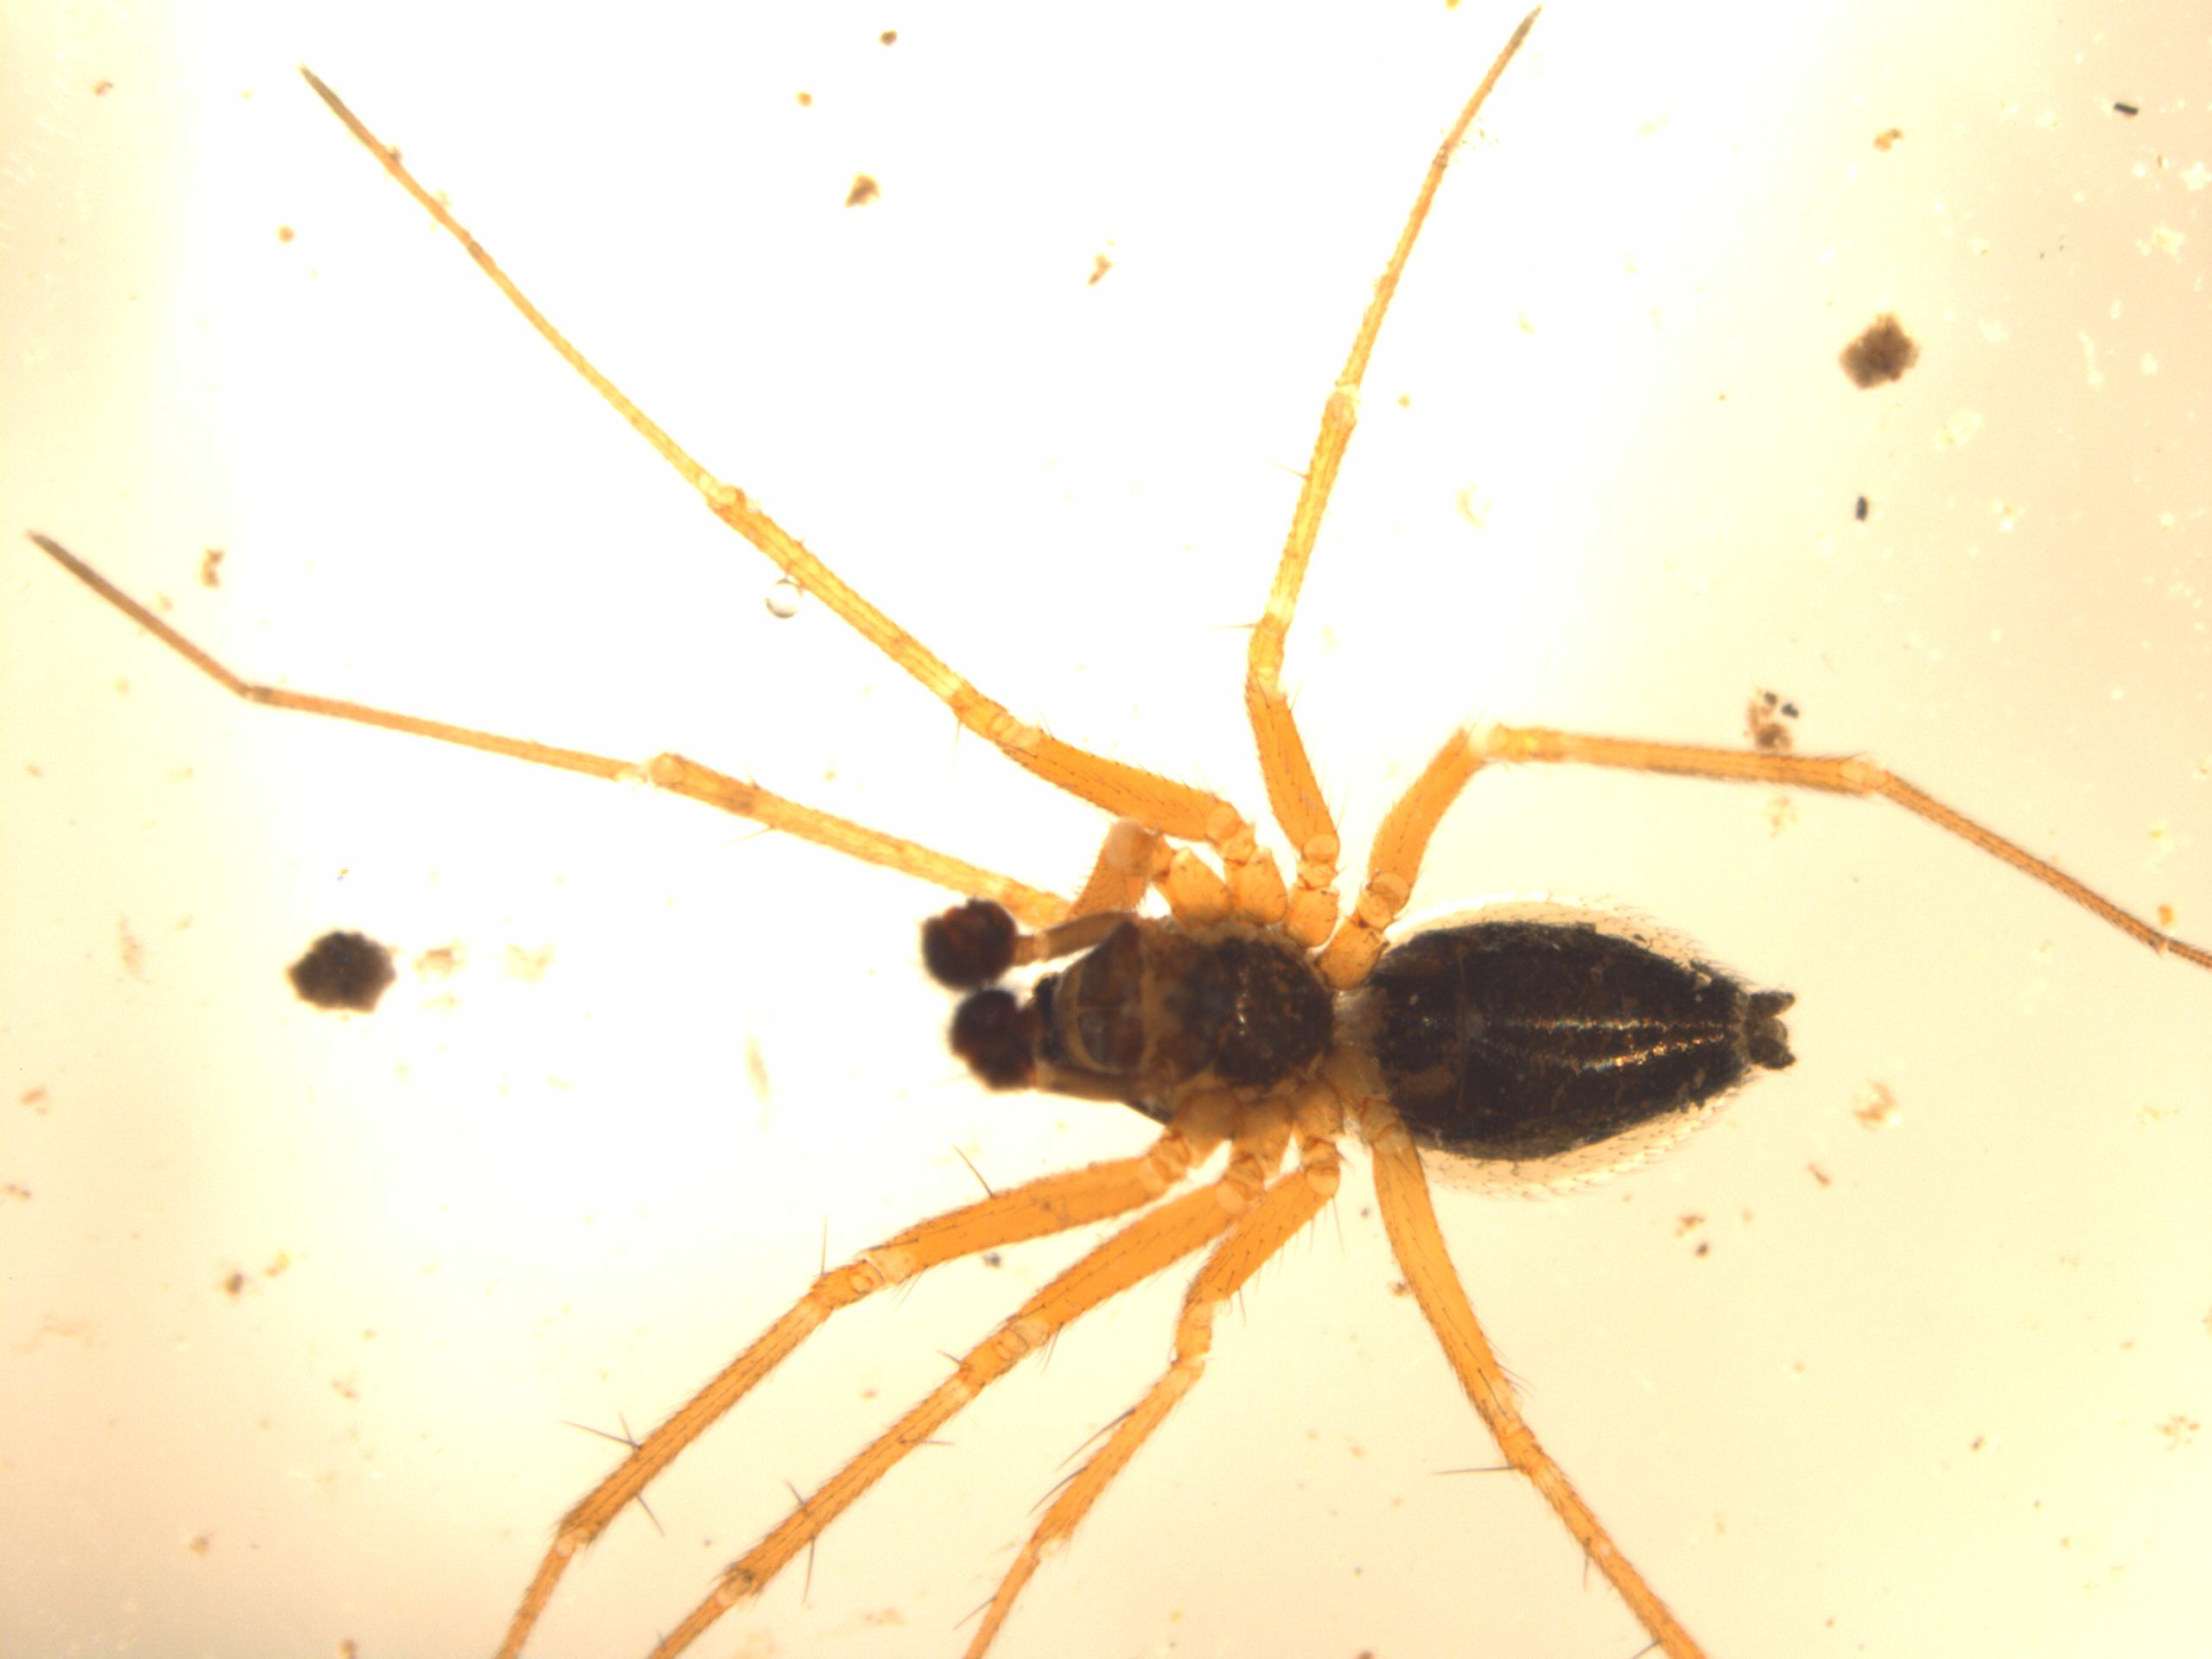
    A recent study on two native semi aquatic spiders, Dolomedes aquaticus and Dolomedes minor, revealed that spider dating is dramatic, but beneficial for their evolution. These spider species spend a lot of time diving for their prey in rivers and streams.

    Male fishing spiders (Dolomedes species) perform complex courtship displays for their partners, which include vibratory, visual, and chemical signals, all just to avoid being killed by the female they are trying to impress, and just so he gets the opportunity to copulate.

    D. aquaticus at Boyle River. Photo by Nicky Lowther (CC BY-NC)

    Unfortunately for these eight-legged boys, their ladies are often aggressive, sexual cannibalism common, and dates often making up a significant portion of these feisty ladies diets.

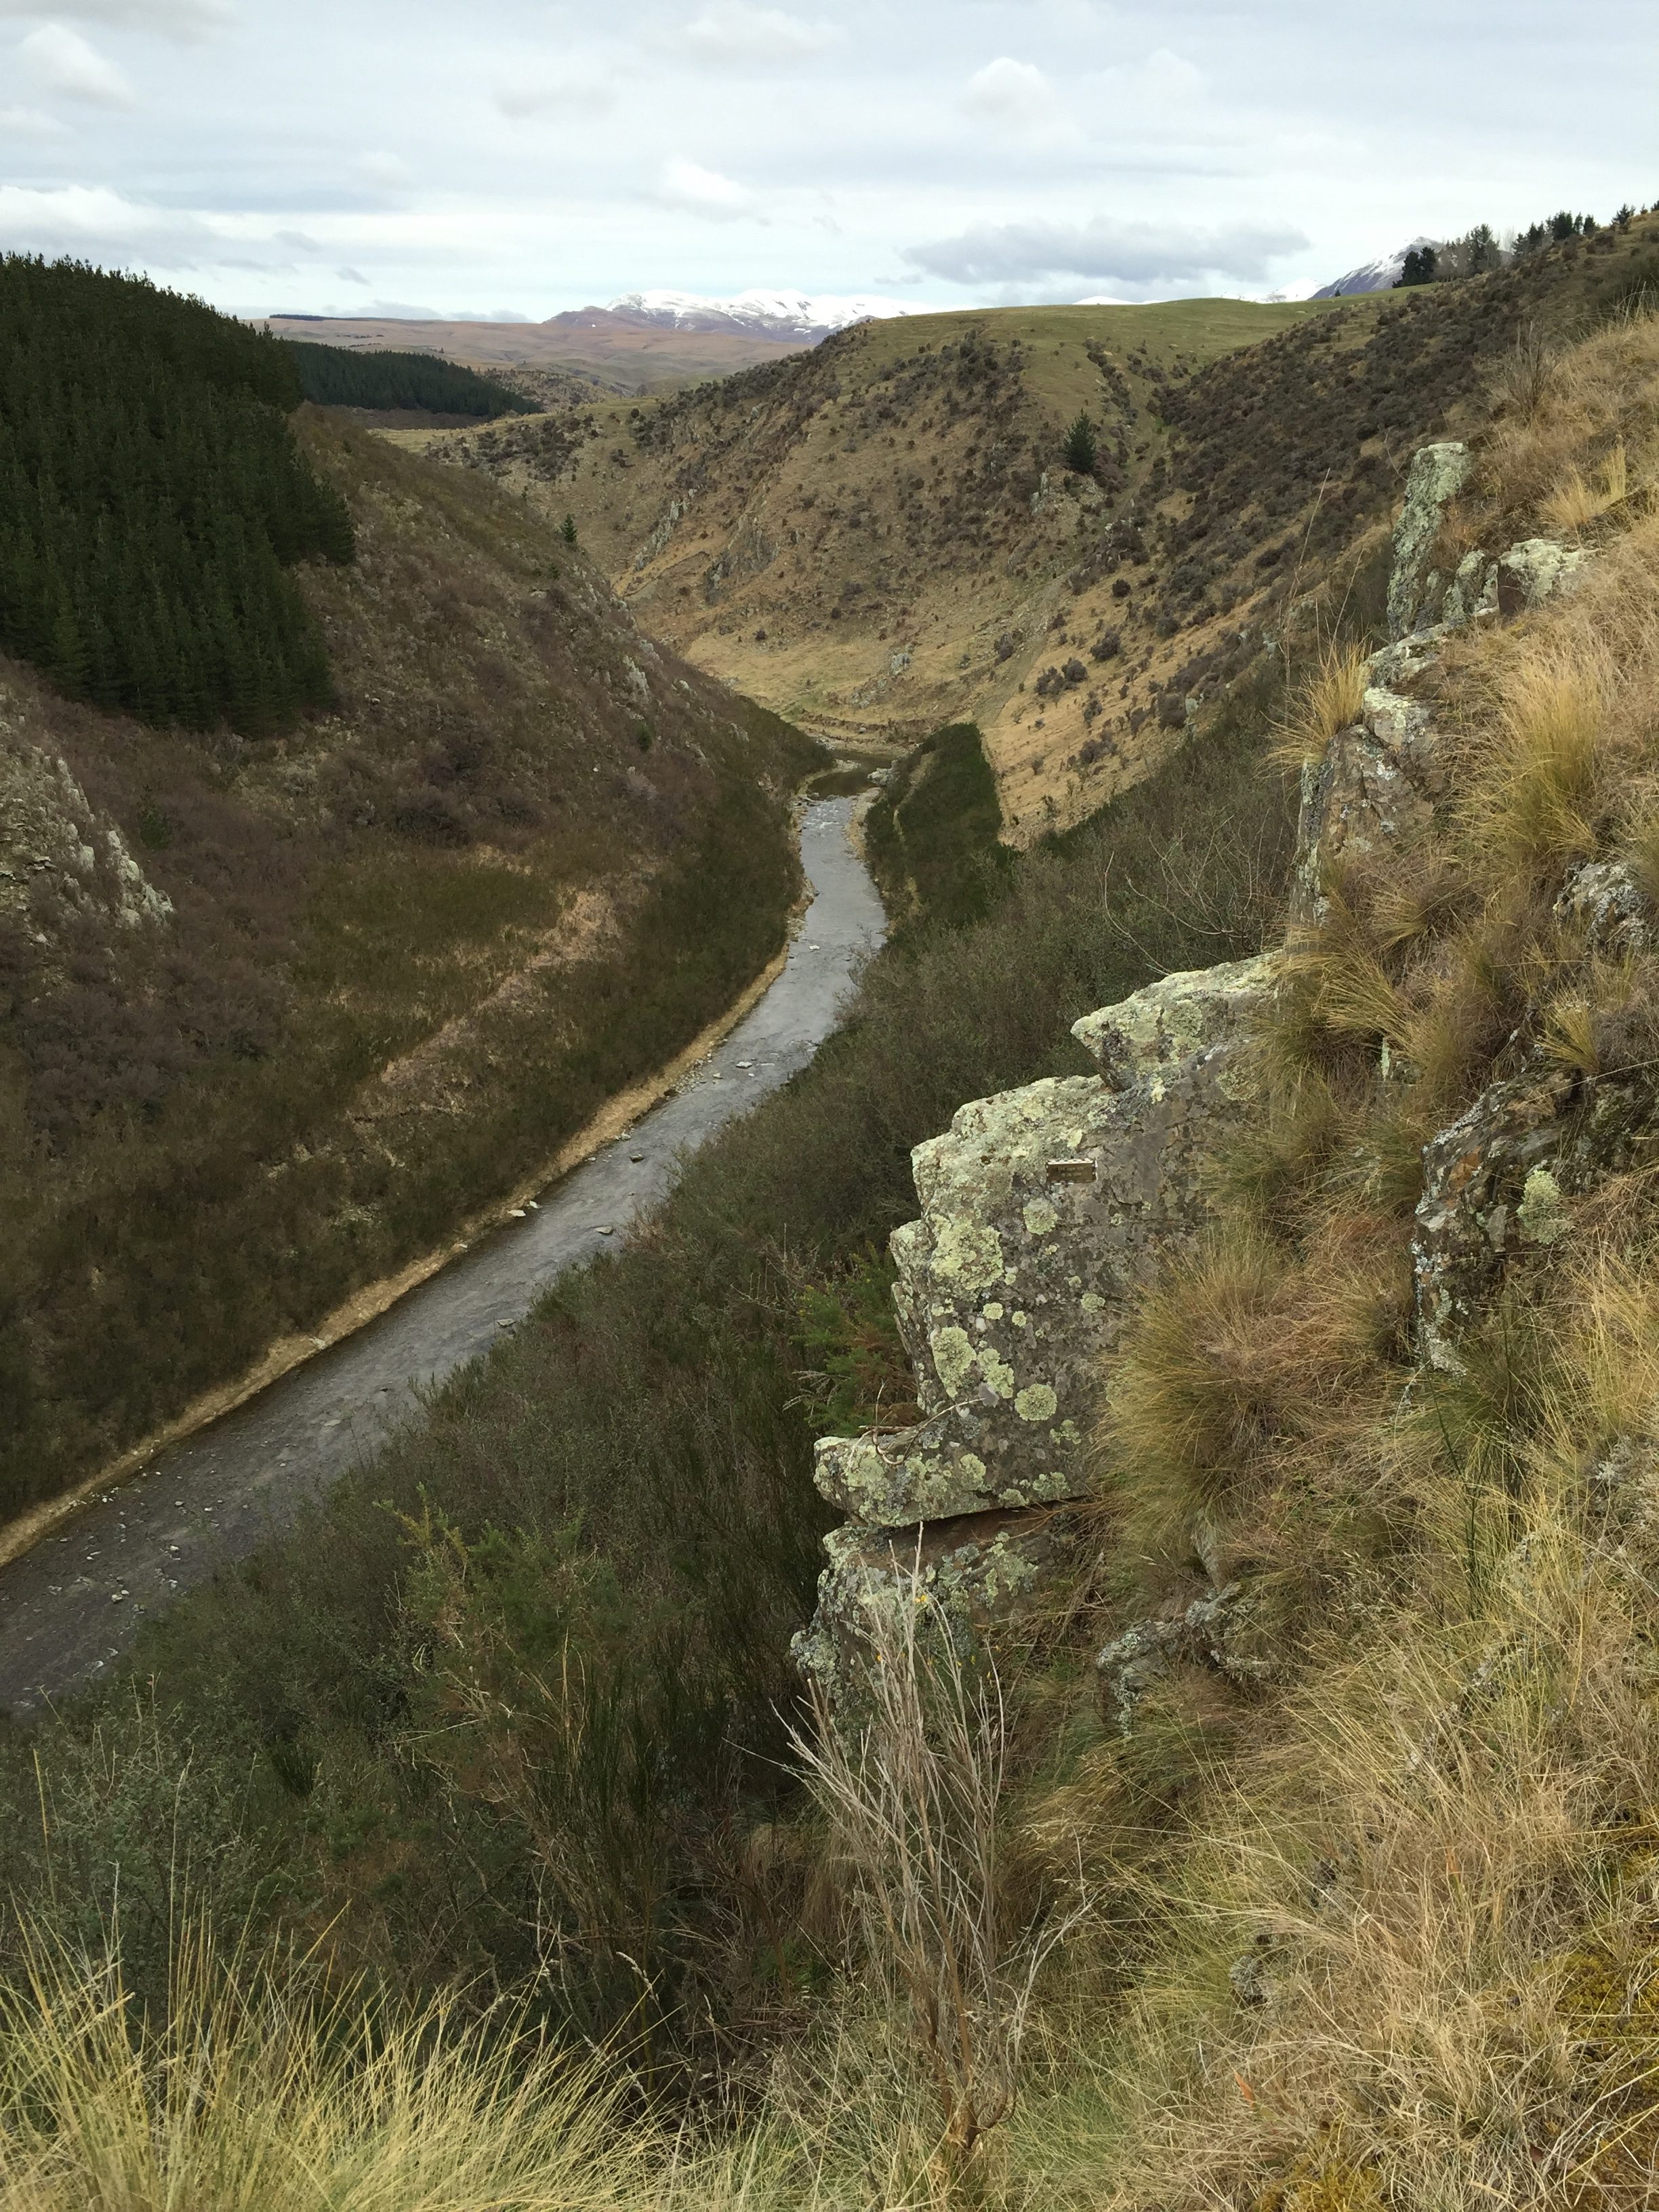
    These fishing spider species are found throughout New Zealand. In a particular area in the lower South Island, something interesting is going on… they are hybridising!… but only in one direction.

    DNA analysis has revealed that mitochondrial introgression has occurred between D. aquaticus females and D. minor males. Introgression is when DNA moves from one species to another. But why, and why only one way? This study investigated the one way introgression between these two species, coauthored by one of New Zealand’s preeminent arachnologists, the one and only Cor Vink.

    These species are closely related and have been observed to interbreed. This causes genes from one species to pass to the other; this process is called introgression. Introgression between these species has only been observed in one direction between female D. aquaticus and male D. minor. Introgression has also only been seen in one location, in the south of the South Island, the “introgression zone.”

    Distribution of D. aquaticus and D. minor within New Zealand, with introgressed D. minor specimens shown. Data from Vink and Dupérré
2010 and Lattimore et al 2011. Also shows collection locations of spiders for laboratory experiments, and Waipara field monitoring site. The introgression
zone is shown by the square box.
    Distribution of Dolomedes aquaticus and D. minor within New Zealand, with introgressed D. minor specimens shown. Data from Vink and Dupérré 2010 and Lattimore et al 2011. Also shows collection locations of spiders for laboratory experiments, and Waipara field monitoring site. The introgression zone is shown by the square box. (Content subject to copyright: please see the study image notes for details)

    The purpose of this study was to investigate life history traits and mating behaviour that promoted and limited introgression that occurs only one way and is limited to one area.

    Spiders were collected from within and outside the introgression zone and mating behaviour was tested in a lab.

    From these experiments, it was found that males from outside the introgression zone were less willing to continue courtship once realising the female was of a different species from themselves, often ghosting halfway through, an experience familiar to those of us in the dating pool. On the other hand, D. minor males within the introgression zone were happy to flirt with any female. This unfussy selection seems familiar. Whether this is a spider phenomenon or a southern cultural trait remains unclear.

    Another interesting find was that female D. minor were more short tempered when it comes to D. aquaticus males, having much higher attack and rejection rates towards D. aquaticus males than the opposite pairing. When a D. aquaticus male attempted courtship, the females often attacked and ate him. This suggests the differences in female behaviour between the two species may have just as much influence on gene flow as mate choice.

    Female receptiveness to male courtship is key for introgression to occur, including female ability to recognise male courtship, female choice, and premating aggressive behaviour, these could all prevent interbreeding in ways that could vary throughout the species’ range.

    Pairings were more successful if the pairings were similar in size. Females in both species are much larger than males, although D. aquaticus is larger overall. It was suggested that one way introgression could be because a female D. aquaticus assumes that a smaller male would be an easier snack, not a great mate!

    D. aquaticus at Boyle River. Photo by Nicky Lowther (CC BY-NC)

    Other potential factors could include that partners in the south could be less choosy in their mate selection as their breeding seasons may be shorter due to natural conditions. D. aquaticus females may think males of their species are rarer, or D. aquaticus male and D. minor female genitalia may not be compatible.

    In summary, it is likely that mating behaviour has a strong influence on the dynamics of introgression gene transfer between these species within the introgression zone.

    Male behaviour may limit introgression one way, preventing mating between D. minor females and D. aquaticus males. Also, female behaviour and choice may limit introgression because of a preference: mate or meal?

    In the end, these spiders prove one thing: rejection is natural selection, and preference is important in evolution. So, next time you have a bad date, consider yourself grateful that your rejection did not end in sexual cannibalism. 🕷️

    This article was prepared by Master of Bioprotection student  Nicky Lowther as part of the ECOL608 Research Methods in Ecology course

    Connolly, S. J., Hunt, J., Curtis, K. M., Painting, C. J., Cooney, C., & Vink, C. (2025). Mating behaviour influences the direction and geographic extent of introgression in New Zealand fishing spiders (Dolomedes). Journal of Evolutionary Biology38(3), 291–304. https://doi.org/10.1093/jeb/voae147  

  • The shrubland invasion: What’s driving it?

    The shrubland invasion: What’s driving it?

    Plant communities dominated by mānuka/kāhikatoa (Leptospermum species)or kānuka (Kunzea species) are an extremely common feature of New Zealand’s native biodiversity. They are found in all manner of shapes, sizes, and habitats – dry and wet, high and low, warm and cold. We’ll call these communities ‘shrublands‘ throughout this text. Reality is much more complex with other types of native shrublands made up of different plant species as well as kānuka and mānuka also forming forests or scrub. There’s a great piece here if you want some more details.

    If you’ve ever bashed through young, dense, mānuka/kānuka shrublands whilst out tramping you might have noticed they aren’t very diverse. That’s because during this young phase they form such a thick canopy and dense shade that other plants find it difficult to establish. Once these stands age the canopy opens up and lets light in allowing other species to take off.

    A natural landscape featuring a mixture of shrubs and grassy terrain, with a mountainous background under a cloudy sky.
    The weed Spanish heath (Erica lusitanica), the lighter yellow-brown plants near the ground, invading gaps in mānuka (Leptospermum scoparium var. scoparium) shrubland on Bealey Spur. Photo Will Todhunter

    These shrublands are important for our native biodiversity. Some are remnants from before humans arrived. Others have expanded following human induced forest clearance and subsequent regeneration. These regenerating shrublands are what we call seral, an intermediate stage in ecological succession.

    Succession occurs when an intact ecosystem is disturbed and doesn’t immediately go back to its final climax vegetation. Instead subsequent vegetation communities gradually replace one another until a climax, or stable, state is reached. Under the right set of conditions kānuka and mānuka can shade out introduced grass species and support a transition of landscapes back to native forest.

    Banks Peninsula has many classic examples of this phenomenon, and if you go for a walk up Bowenvale Valley, in Christchurch, you should be able to spot large areas of planted kānuka where Christchurch City Council is trying to jumpstart this process.

    Including these shrubland species, Aotearoa has a grand total of 2,522 native vascular plant species. This total is far outnumbered by the staggering amount of introduced plant species, with at least 24,744.

    In many cases introduced plants can establish in the wild and invade natural ecosystems, including native shrublands. We will call these invasive introduced species weeds. These exotic weeds can negatively impact our biodiversity, displacing native plants and changing the ways our ecosystems function. Weed invasion has been well studied in forest and grassland ecosystems in New Zealand, but less so in shrublands. It is important to understand what drives weeds to invade shrublands, as this can help guide us when considering actions to protect these habitats.

    Laureline Rossignaud and Philip Hulme are researchers from Lincoln University who focus their research efforts on biological invasions, including weeds. They looked at information from 247 monitoring plots placed within shrublands across the country to better understand weed invasion into these habitats. Many studies have already investigated whether the number of native plant species in an ecosystem is related to weed invasions, but few studies have also considered the influence of climate, landscape features and the structure of the plant community in question. So, when this pair dived deeper into this topic, what did they find?

    Both the number of different species (species richness) and the size of the area covered by a species (its cover) play a role, but they don’t always align. Some shrublands had high numbers of species with low cover, whilst others had low numbers of exotic species but these were high in cover. This second example can be seen when a few aggressive weeds dominate.

    Dense forest scene with bare trees and lush green undergrowth.
    Shrubland on Banks Peninsula. Photo by Will Todhunter CC BY

    Low species richness, high species cover. The above image captures this, showing vegetation in a mature kānuka stand on Banks Peninsula. An open canopy of kānuka sits above a lower tier of native saplings of māhoe (Melicytus ramiflorus subsp. ramiflorus), poroporo (Solanum laciniatum) and kawakawa (Piper excelsum subsp. excelsum), and a dense ground cover of the highly invasive exotic veldt grass (Ehrharta erecta). The veldt grass forms such dense mats that it limits the establishment of most other plants and was once voted NZ’s worst weed!

    A clear takeaway from the study was that the physical structure of shrublands plays a big role in determining how susceptible they are to exotic plants. Shrublands with dense canopies and multiple layers of vegetation act like a shield, limiting open ground and leaving less space for weeds. Shrublands with open areas let in more sunlight and have more available options for weeds to gain a foothold.

    The surrounding land cover and land use heavily influenced weed invasions. Where shrublands were close to human modified landscapes ,weed invasion increased, and the same when shrublands were close to rivers. Modified landscapes typically had a higher number of weed species, providing a seed source that can then move into more natural areas.

    Size and shape of shrublands matters. Shrublands with long edges experienced higher levels of weed invasion, with edges often having more disturbance and being more accessible to invaders. This is known as an “edge effect“. Topography is another contributor, with lower and flatter areas more invaded than those that are steep and/or at higher elevation

    Unsurprisingly, climate also played a major role. Warmer temperatures were shown to increase weed invasion, and many introduced plants thrived in mild conditions. The expansion of suitable habitat ranges of weeds through a warming climate is yet another reason to be concerned about climate change!

    Scrubland on Onawe Peninsula, Banks Peninsula. Photo by Adrian Paterson

    Lastly, these researchers found that no single factor could fully explain weed invasion, it’s all about a combination of various factors. Something that readers might have expected.

    Through my work in conservation I’ve been lucky enough to spend time in a range of shrublands. Some of the most special are the fragmented remains of the once extensive kanuka drylands of the Canterbury Plains, such as Motukānuka Scientific Reserve. Research has found that intensive land use change adjacent to these remnants has strongly contributed to increased weed invasion on the edges. Irrigation changing water availability and increased nitrogen availability from surrounding farms were attributed as two of the main drivers here.

    There’s a couple things we can learn from these studies when thinking about protecting shrublands. To reduce the impacts of exotic plant invasion, the larger the area of shrubland the better. Dense, structurally rich vegetation is going to be more resilient to invasion. However, often small fragments of biodiversity are all that are left to work with, so factoring in a buffer from surrounding land use then becomes important.

    In many situations active management of weeds, such as physical control using herbicide, is essential to protect native species and ecosystem function’s from their impacts.

    So now that you know a bit more about shrublands, keep an eye out for some of the features discussed here. Keep learning about the native and introduced plants of New Zealand, and get out there with the right people and deal to some weeds!

    This article was prepared by Will Todhunter, Postgraduate Diploma in Applied Science student, for an assignment in ECOL608 Research Methods in Ecology.

    Rossignaud, L., & Hulme, P. E. (2023). Native vegetation structure, landscape features and climate shape non-native plant richness and cover in New Zealand native shrublands. Diversity and Distributions, 29(8), 1009–1020. https://doi.org/10.1111/ddi.13713

  • It’s only forever, not long at all

    It’s only forever, not long at all

    Time has very much been on my mind lately.

    To be exact, it is probably the comprehension of time that has been at the forefront.

    I just went to the 40th anniversary of the movie ‘Labyrinth’, a quirky movie by Jim Henson of muppets fame, written by Monty Python Terry Jones, and starring David Bowie as the Goblin King (and who also wrote the songs) and Jennifer Connolly in her first role. Essentially a teen babysitting her baby half-brother wishes the goblins would take him when he cries to much. They do and many dream-like twists and turns occur in the goblin labyrinth as Sarah finally outwits the Goblin King to get the baby back.

    I was 19 when I went to the cinemas to see this movie. It’s a little intimidating to think that 40 years have passed since that that fresh-faced Adrian was starting his honours year at Otago. In some ways it seems like yesterday, in others a lifetime has passed by. I mean I’ve done a PhD, got married, became a lecturer, raised three sons to independence, supervised 78 postgraduates to completion, travelled, read a lot of Tolkien, listened to a lot of Kate Bush, played a lot of games, coached a lot of cricket and so on.

    Adrian in 1989 – starting his research career with behavioural work on native bees. Image by Adrian.

    (By the way the movie holds up well, the practical effects are still amazing, the songs catchy, Bowie’s pants are still alarmingly tight, although there are parts that have not aged well, especially the early computer effects – I’d like to think of that as a metaphor for something!)

    At a smaller scale, my granddaughter is about to turn one. (Note even the idea of being a grandfather makes me contemplate time a lot!) As an evolutionary biologist I have always said to my classes that, from an evolutionary fitness point of view, becoming a grandparent is the goal – you have reproduced and your children have reproduced. There’s not much more that you can do.

    I’ve also found that being a grandfather is a wonderful job in its own right! It feels like the most important thing that I could be doing. So yah for evolution!

    The last year has whizzed by and granddaughter has changed from an organic lump into a moving, noise-making, interactive Individual. Biology is amazing. But where did that year go?

    The perception of time is a funny old thing. With regards to my granddaughter the last year has sped by. On the other hand, I got a bad concussion last January (I zigged when I should have zagged) and the recovery from that, still ongoing, seems to have taken a decade. Same period of time but contrasting experiences!

    Adrian in 2026 with granddaughter. Image by Julie Paterson.

    Our poor human perception of passing time can really get in the way of understanding science, especially the sciences that take place over long periods, such as evolution, geology, astronomy. A particular issues is getting our minds to comprehend just how much time there has been.

    In my teaching I have used several analogies to try and get across the sheer scope of time. You want to take something familiar and use that as a metaphor. I’ve walked around the classroom where every step is 50 million years, I’ve used a rugby game where every minute is 25 million years. Usually, I am trying to emphasise that the dramatic stuff that we are most interested in happened recently and a looooooong time from the beginning.

    So here I go again trying to give a sense of the time available for the history of the Earth! This time let’s think about ‘The Lord of the Rings‘. Most people know the basic story: Bilbo gives Frodo a magic ring which turns out to be the source of the Big Bad of the world’s power that must be destroyed in the volcano where it was made. Shenanigans ensue.

    So, lets say we start with Chapter one and finish when the hobbits destroy the ring at Mount Doom (I know there is a prologue and there are several chapters after this but let’s stick with this basic journey of Shire to Mordor). In my copy of the ‘The Lord of the Rings‘ (LotR)this part of the story takes 916 pages. If the Earth forms with the first sentence of Chapter 1 “When Mr Bilbo Baggins of Bag End announced…” we are at 4.5 billion years ago.

    Each subsequent page is then the equivalent of 5 million years (still a period of time that is unimaginably long!).

    First evidence of life on Earth appears around page 54/916. In our read through of LotR this is in the The Fellowship of the Ring – Three is Company where Sam and Frodo meet Gildor and the elves within the Shire​ as they camp after leaving Bag End.

    Before long the elves came down the lane towards the valley” ​

    Prokaryote fossils (bacteria) appear in the fossil record​ around page 114/916 where Tom Bombadil rescues the hobbits from the clutches of a barrow wight. (The Fellowship of the Ring – Fog on the Barrow Downs)

    “At these words there was a cry and part of the inner end of the chamber fell in with a crash.”

    We finally see complex cells (eukaryotes) – the kind that would lead to you, me and the trees over half way through on page 503/916. Gandalf and Aragorn are talking to a defeated Saruman in the wreck of Isengard (​The Two Towers – The Voice of Saruman).

    “They came now to the foot of Orthanc.”

    Note that we have missed the hobbits fleeing the Nazgul and the Shire, Rivendell, the Mines of Moria, Lothlorien, Boromir’s death, the breaking of the Fellowship, Gollum, Ents, Rohan and Helms Deep!

    Gollum by Julie Paterson

    Multicellularity, sticking more than one cell together to form more complex organisms occurs on page 709/916. Pippin and Gandalf have ridden to Gondor and are meeting with Lord Denethor​ (The Return of the King – The Siege of Gondor).

    “Before long he was walking with Gandalf once more down the long cold corridor to the door of the Tower Hall.”

    The Cambrian Explosion, a point in time where we see fossils suddenly appear for almost all modern groups happens on page 803/916. We have sped past the journeys with Gollum, the encounter with Faramir and the Oliphaunt, and Gollum’s betrayal of the hobbits to Shelob and arrive at Sam rescuing Frodo from orcs after he has been poisoned by the spider (The Return of the King – The Tower of Cirith Ungol)

    “At that rage blazed in Sam’s heart to a sudden fury.”

    Land is colonised by plants and animals on page 833/916.The siege of Gondor is in full swing and Denethor perishes in a bonfire meant for the wounded Faramir (The Return of the King – The Pyre of Denethor).

    “Gandalf in grief and horror turned his face away and closed the door.”

    Reptiles, particularly lineages leading to dinosaurs become dominant by page 847/916 (The Return of the King – The Houses of Healing). Aragorn, Gandalf, Pippin and the wounded Merry reunite after the Battle of the Pellenor Fields​ where the Mordor forces have been beaten back and the Witch King destroyed.

    “And get the pipe out of my pack, if it is unbroken.”

    The extinction of the dinosaurs and many other things occurs on page 893/916 where Frodo and Sam are lost in the mountain border of Mordor (The Return of the King –The Land of Shadow).

    “The tops of the Morgai were grassless, bare, jagged, barren as a slate.” ​

    The Primate lineage that becomes the Hominids, our ancestors, evolves​ on page 906/916. Frodo and Sam, starving and thirsty, approach Mount Doom through the surrounding wasteland (The Return of the King – Mount Doom).​

    “Then let me carry it a bit for you.”

    Finally, on page 916 we come to the last 5 million year. Frodo and Sam are slumped on the slope of an erupting Mount Doom after destroying the ring (The Return of the King –Mount Doom). All of human history​ fits into the last sentence

    “Here at the end of all things, Sam.”

    So is this effective? I guess one needs to know the story to get the full effect but even just looking at the page numbers will give you the right idea. Most of the interesting stuff happens in the last few pages. Almost nothing much happens in the first two thirds. Life, itself, arrives surprisingly early.

    I feel like it helps me with to work with the notion of lots of time.

    It’s only forever, not long at all

    sings David Bowie in the song Underground in the Movie Labyrinth. The more I think about it, the more I think that this is a very perceptive line.

    Still, I am out of time for now. I’m off to celebrate my granddaughter’s birthday.

     The author, Adrian Paterson, is a lecturer in the Department of Pest-management and Conservation at Te Whare Wānaka o Aoraki Lincoln University. He has experienced a lot of time.

  • Kiwi: now in 3D

    Kiwi: now in 3D

    ‘Coming soon in 3D!’ Periodically throughout my life movie-makers have dabbled with making films that we can watch in three dimensions. You would get your special glasses before the movie session and then sit there wondering when to put them on until the action got going.

    To be honest I don’t remember many of the movies that I saw like this. The Avatar movies have always had the option and I watched at least the second movie this way. Spears and monsters would lunge out of the screen at you.

    Other than that I am drawing a blank. This is not to say that every 3D movie is bad but just that 3D on its own doesn’t make a film more memorable.

    Avatar Adrian! Look out for the arrow!

    I don’t even dislike the experience despite having to wear the 3D glasses over my own glasses. There is something immersive about dodging things ‘coming out of the screen’. However, I seldom choose this option if 2D is available. It all seems a bit too much like work perhaps?

    Adding a third dimension can help with appreciating scale and movement though. It can also help with identifying who’s who in the screen – there’s just a bit more information that your brain can use.

    Identifying individuals is a big deal in biology, especially conservation. When you have a small population you are interested in individuals. How are they doing? Are they breeding? Who do they hang out with?

    Of course, for many species there are not a lot of features to differentiate between individuals. They are similar in height, uniform in coloration, and have similar behaviours.

    To make them more distinctive we could always band our target with bright colours or paint an obvious mark on them but this involves capturing and interacting with the individual. This causes a great deal of stress and catching individuals is not always simple.

    Ideally we could use cameras to take pictures that we could measure features in that are unique to an individual. Two dimensional pictures require an individual to be in an exact place with an exact orientation for this to work. So this is not a reliable method.

    Bit wait! … Coming soon in 3D!

    It turns out that if you take pictures with different devices from slightly different angles at the same moment then you can much more accurately calculate measurements on individuals. At least in theory.

    Jane Tansell with her trusty kiwi dog. Picture from Jane Tansell.

    Jane Tansell, a recently completed PhD student at Lincoln University, and her supervisors, Adrian Paterson and James Ross, set out to see if we could use this idea to identify kiwi. Kiwi populations and individuals are difficult to measure. They are nocturnal, usually found in scrubby terrain, are reasonably featureless, and spend a lot of time in burrows. We can use trained dogs to find them but this is quite stressful for kiwi. We can listen to their calls during the night but this is difficult to split into different individuals and certain parts of the population don’t call anyway.

    Trail cameras have been used to successfully locate kiwi. Jane wondered if she could pair cameras 12-25 cm apart, taking images that could be used to essentially create a 3D image of features on each bird. Jane knew that kiwi bills vary between individuals and can be used as an ID.

    Jane worked with the more technically literate Maurice Kasprowsky and Tom Gray to cobble together the cameras and get them to work together.

    Jane, as reported in NZ Journal of Zoology, first tried the setup on a taxidermied kiwi in good light conditions. She found that the cameras could be used to measure the bills to within 1.5% of their actual length. This was a great achievement and would certainly be able to determine individuals.

    In theory we should be able to photograph kiwi and recognise them by measuring their bills. Image from Adrian Paterson.

    Jane then set up field trials with live kiwi. In the real world, with low light and moving birds the cameras were less efficient. At worst they were terrible but often they were within 3-4% of the actual bill length. This is not good enough to replace current field identification methods but it was still quite impressive given the relatively jury-rigged setup.

    Improvements in cameras, especially 3D cameras, are happening quite quickly. With some more trial and error Jane should be able to start reducing the error enough for this to be a viable noninvasive method for following kiwi in the field.

    While this is not as exciting as an arrow flying at you from an Avatar movie, this use of 3D does have real world uses that will help with understanding a national icon!

    The author, Adrian Paterson, is a lecturer in the Department of Pest-management and Conservation at Te Whare Wānaka o Aoraki Lincoln University. Adrian is a kiwi but unfortunately has no bill to measure.

  • Tackling feral cats in Aotearoa New Zealand

    Tackling feral cats in Aotearoa New Zealand

    Feral cats (Felis catus) are among the most proficient and effective hunters in the world. In Aotearoa New Zealand (NZ), their skills are lethal to native species that have evolved without mammalian predators. Feral cats have been linked to significant biodiversity declines across the country. Cats are opportunistic predators that hunt ground-breeding species, like birds, bats, reptiles and even some insects- many of which are endemic.

    Fig 1: It looks like siblings fighting over a small bird, a moment that captures the competitive behavior of feral cats (Image by- Gilbert Mercier, Flicker User

    The extinctions of six endemic birds are linked to feral cats. Well-known cases include a single cat, Tibble, that caused the extinction of NZ’s only flightless song bird: Lyall’s Wren on Stephens Island. A single cat killed 120 endangered native short-tailed bats in one week on Mt. Ruapehu. Dotterel populations on Stewart Island, Grand and Otago skink populations in southern ANZ are at risk due to feral cats. The list of species pushed to the verge of extinction by cats is long and growing.

    Yet despite their impact, feral cats are not currently included in NZ’s Predator Free 2050 campaign. This raises a major question: how is NZ tackling the feral cat problem? 

    With growing concern for native wildlife,  the government has implemented several methods to eradicate or control cats: lethal baiting, trapping, shooting, and fencing. While putting these methods into action is necessary, it’s equally important to ask their effectiveness: Are they actually working? And how can we tell?

    Fig 2: Feral cat awareness at Arthur’s Pass Wildlife Trust (Photo credit: Muhammad Waseem (used with permission)).

    These were the very questions a group of researchers from Lincoln University set out to explore. Using camera traps, they conducted a study on Hawke’s Bay farmland to test whether trapping and shooting could effectively control feral cat population, and whether the area will be re-invaded over time, to measure the effectiveness of the method.

    Forty motion-sensitive cameras stood beside the traps like sentinels, monitoring everything. Cats walked into the view, lured by rabbit meat and ferret scent. The cameras recorded activities before, during, and six months after the control operation. Before the operation 20 cats were detected. 17 feral cats were then removed (shot). The result? An 84% drop in both cat numbers and camera detections.

    Aware of the risk of reinvasion, the researchers monitored the site again six months later- and detected only three new cats. The outcome was encouraging and demonstrated how proper methods combined with well-monitored action can make real difference. With the help of camera traps, the research could measure the effectiveness of the control operation and can suggest similar methods in areas facing feral cat issues.

    Today, thanks to advanced technology like camera traps, monitoring has become much more efficient and convenient. This allows conservationists to evaluate their methodologies, observe activities remotely, and respond effectively.

    How did cats become a serious ecological problem in NZ?

    In my home country of Nepal, cats are seen as beloved pet and, traditionally, the guardians of grain stores, not as an ecological threat. As someone new to NZ conservation practice, I initially found the conservation method used in this study confronting. But the more I learned, the more curious I became: how did a country with no native mammalian predators come to see cats as such a serious problem?

    Fig 3: Stray cat basking sun on Fairmaid Street, Lincoln (Photo: Author 04/01/2025)

    Cats didn’t arrive in NZ until the mid-1800s. Earlier cats had visited along with Captain James Cook. His ship, plagued by rodents, carried cats as a solution to control pests and protect food supplies.

    European settlers brought cats as companions. Some escaped or were abandoned, eventually forming a wild population. Ironically, many animals (and even people) arriving by ships ended up becoming invasive. Over time, their arrival became strongly linked with biodiversity loss.

    Today the feral cats are  officially recognised as invasive predators. They not only kill native wildlife but also spread disease. It is no coincidence that many native birds began to disappear after cats were introduced. In the NZ conservation story, it’s not unusual to say: “To solve one problem often means creating another!”.

    Although some early impacts were noticed, such as the extinction of the Stephen Island wren, surprising these events were simply viewed with the mindset  as nature improving, where invasive species were seen as improvement rather than threats.

    Cats, whether brought to control rodents or to ease the settler’s solitude, may have served a short-term purpose, but over time introducing them proved to be a double-edged sword, causing severe harm to NZ’s native wildlife.

    Learning this made me realize that today’s conservation challenges are deeply connected to historical choices!

    Moving ahead

    While we cannot re-write history, we can certainly learn from it!

    Fig 4: Who decided which story to tell? The Great Hall stained-glass window at University of Canterbury made from 4,000 pieces of glass, showing Captain James Cook at number 19 (Photo: author 02/05/2025).

    The journey of cats in NZ is a classic reminder of how small actions can have a large ecological impact. The feral cat issue isn’t just about one species nor is it the only invasive challenge NZ faces, it’s about how we approach conservation in a complex and ever-changing environment.

    Looking back, we don’t know how much damage to NZ’s biodiversity could have been prevented or reduced if the scale of damage was understood earlier. As the country continues its battle against introduced species to conserve biodiversity through Predator Free 2050 campaign, integrating reliable monitoring tools like camera traps will be crucial in making informed and effective conservation decisions.

    The author, Pareena Khadka, is a postgraduate student in the Master of Applied Science at Te Whare Wānaka o Aoraki Lincoln University. This article was written as an assessment for ECOL 608 Research Methods in Ecology.

    Paper reference: Nichols, M., Glen, A. S., Ross, J., Gormley, A. M., & Garvey, P. M. (2023). Evaluating the effectiveness of a feral cat control operation using camera trapsNew Zealand Journal of Ecology, 47(1), Article 3501. https://dx.doi.org/10.20417/nzjecol.47.3501

  • Our plants are not being poisoned by 1080 possum baits

    Our plants are not being poisoned by 1080 possum baits

    I’ll admit, before taking the 16 hour flight from Arizona to Christchurch, I didn’t know much about New Zealand besides ‘What We Do in the Shadows’, Karl Urban, and affordable yarn. I was especially excited to get my hands on possum yarn.  

    Possum yarn is coveted by the knitting community for its lightweightedness and warmth, only surpassed by the fur of arctic foxes and polar bears. And let me say that I absolutely think that the possum yarn was worth every dollar. With just 400 meters (one skein/ball) I was able to knit up a cabled hat, mittens, and still have some left over for some ankle length socks!  

    The feeling of possum yarn is incredibly soft and the natural brown color of the possum fur mixed with merino sheep wool makes for a more muted (in a good way) color palette. However, I recognise that the brushtail possum is a prevalent pest in New Zealand; so much so that drastic measures like Compound 1080 poison baits have been used since the mid-1950’s to control this introduced species. 

    Common Brushtail Possum by Catching The Eye, 2014 (CC BY-NC) 

    Compound 1080 for pest control in New Zealand 

    To put it simply, sodium fluoroacetate (AKA Compound 1080) is a vertebrate pesticide used to control introduced mammal species, such as rats, mice, feral cats, and possums. Without Compound 1080, these species decimate the population of endemic plants and animals only found in New Zealand. The compound is dispersed by aircraft(i.e. helicopters or fixed-wing planes) in either a carrot or cereal bait.  

    According to my professors, everyone has an opinion on the use of 1080. While Compound 1080 is great when it works, there are concerns from both the general public and Māori communities. From a public perspective, 1080 does have the real danger of killing people’s cats and dogs if accidentally ingested. As a pet owner myself, this is especially scary because my cat and dog would likely eat the bait before I’d have a chance to recognise what it was. Additionally, the Māori community has concerns about Compound 1080 leaching into the soil and then poisoning plants used for food or medicinal purposes.  

    Back in September 2003, a cooperative effort was made in New Zealand by the Ecology Department at Lincoln University, Landscape Research, Lake Waikaremoana Hapu Restoration Trust, and the Tūhoe Tuawhenua Trust to determine if Compound 1080 negatively impacts plant species used by the Ngāi Tūhoe Māori and if not, how to get this information spread among the iwi. To achieve this, a study was conducted on wild-growing pikopiko (AKA hen and chicken fern) and Karamuramu plants in State Forest Block 100, just south of Lake Waikaremoana. 

    Hen and Chickens FernAsplenium bulbiferum by John B, 2016 (CC BY-NC) 

    Ten individuals of each plant species were chosen and placed underneath wire mesh as protection against herbivory. Of the twenty plants, 3 of each species were exposed to a single Whanganui No. 7 cereal 1080 bait. Samples were taken from the plants throughout the study (days 0, 3, 7, 14, 28, and 56) as well as bait samples at the very beginning and end, to test for potential shift in potency over time.  

    More than 99% of the 1080 had disappeared from the baits by day 56 and all but one plant sample had no remaining amounts of 1080 within their systems. Of the twenty plants sampled, only one Karamuramu plant retained the toxin; and that was at most 5 parts per billion (ppb) and was completely gone by day 28.  

    Foodweb database 

    Karamuramu plantCoprosma robusta by eyemac23, 2025 (CC BY-NC) 

    I don’t know about you, but I’ve never been a huge fan of reading scientific articles. They’re always confusing, too long, and to be honest, a bit dry. Sometimes I wish I could, instead, just scroll through a presentation with all the information presented short and sweetly.  

    Oh wait, this article did just that and made up not only a comprehensive food web on the interactions of the forest environment with 1080, but also added hyperlinks to it that opens a PowerPoint!(Note: the article did not include the link to the original PowerPoint, only an image of one of the slides.) Each PowerPoint slide focuses on a single plant or animal species impacted by 1080, the intensity of 1080 impact, and additional reference sources. It’s easy to digest and leaves room for more research if one wanted to do so.  

    Concerns from the Māori community 

    In conclusion, I get why using Compound 1080 is necessary against invasive species, like the brushtail possum and it will likely never impact me on a personal level unless it somehow leaches into a batch of yarn or something. However, I also can understand why the Ngāi Tūhoe Māori tribe are still hesitant as 1080 is still a toxin and we may not know the full impacts. While the decision to use Compound 1080 in the Te Urewera area is complicated, in 2016 those from the Ngāi Tūhoe tribe largely oppose aerial drops since it cannot be controlled.  

    Final thoughts 

    I think it’s important to note that for a 70 kg person to actually die from consuming 1080 that has remained in a Karamuramu plant, (and even in this example the probability of death is only 50%), they would have to eat 28 tons (28,000 kg) of the stuff. And that’s also if the plant is eaten raw, normally it’s boiled in water as a tea and diluted even more. Personally, after reading this I wouldn’t be too worried about Compound 1080 in my plants but I will still leave the risk assessment up to those in the Māori community on an individual level. 

    For now, I will continue to enjoy knitting with the luxurious possum yarn until the pests are eradicated from New Zealand once and for all.  

    This article was prepared by Master of International Nature Conservation student Marie Frackiewicz as part of the ECOL608 Research Methods in Ecology course.
    OGILVIE, S.C., ATARIA, J.M., WAIWAI, J., DOHERTY, J., MILLER, A., ROSS, J.G. and EASON, C.T. (2010), Vertebrate pesticide risk assessment by indigenous communities in New Zealand. Integrative Zoology, 5: 37-43. https://doi.org/10.1111/j.1749-4877.2010.00190.x  

  • The three bird-iteers: all for monitoring and monitoring for all!

    The three bird-iteers: all for monitoring and monitoring for all!

    My time at Lincoln University has taught me that when it comes to bird monitoring, the most common practice is the 5 minute bird count (5MBC). This method is a simple and effective way of counting birds within a specific area by recording sightings and calls. Much of the time, using 5BMC, it is likely that you will not see the bird you are hearing, which is why being able to identify New Zealand birds just by sound is a very good skill.

    Lincoln University legend Jon Sullivan did a study on different bird data collection methods that could also mahi together to build a more accurate picture of birds in an area. The study focused on wider Christchurch, beginning in 2003, and recorded patterns in bird species within the area.

    One method that was used was the stationary method , which is pretty much the same as the 5MBC but is extended to 20 minutes. The other method used was the ‘mobile method’, also known as the ‘line-transect method’, where you collect data while moving at a fast pace, perhaps by bike, car, or running.

    Now to the fun stuff – birds!!

    In Jon’s study there was a focus on three bird species, which I call the three bird-iteers (with apologies to Alexandre Dumas). These are the grey warbler, fantail and the bellbird. These endemic birds are very adaptable to recent changes for forest bird species.

    Grey Warbler

    The grey warbler (Gerygone igata, riroriro) are found throughout New Zealand. They are small, grey/brown with a more pale shade of grey for the face to throat. They weigh approximately 6.5 g (lighter than a mouse) and their diet consists of insects and spiders.

    Grey Warbler (Gerygone igata)

    Grey Warbler. Photo CC BY Mikullashbee, Flickr

    Fantail/pīwakawaka

    Fantails are one of my many favourite bird species, as they love to follow humans around when you are on bush walks. Fantails are able to adapt to environments that have been changed by humans, which is not very common for New Zealand native birds. Fantails (Rhipidura fuliginosa, piwakawaka) are often found in open native bush, exotic plantation forests, orchards and gardens. Their diet consists of insects, especially small species. Fantails are a small bird about the size of a house sparrow, but what makes them so distinctive? Well the answer is in their name…. Yes their tails, like their name suggests they have a long tail that fans out like a well a fan.

    Fantail

    Fantail. Photo CC By Chris S, Flickr

    Bellbird/ Korimako

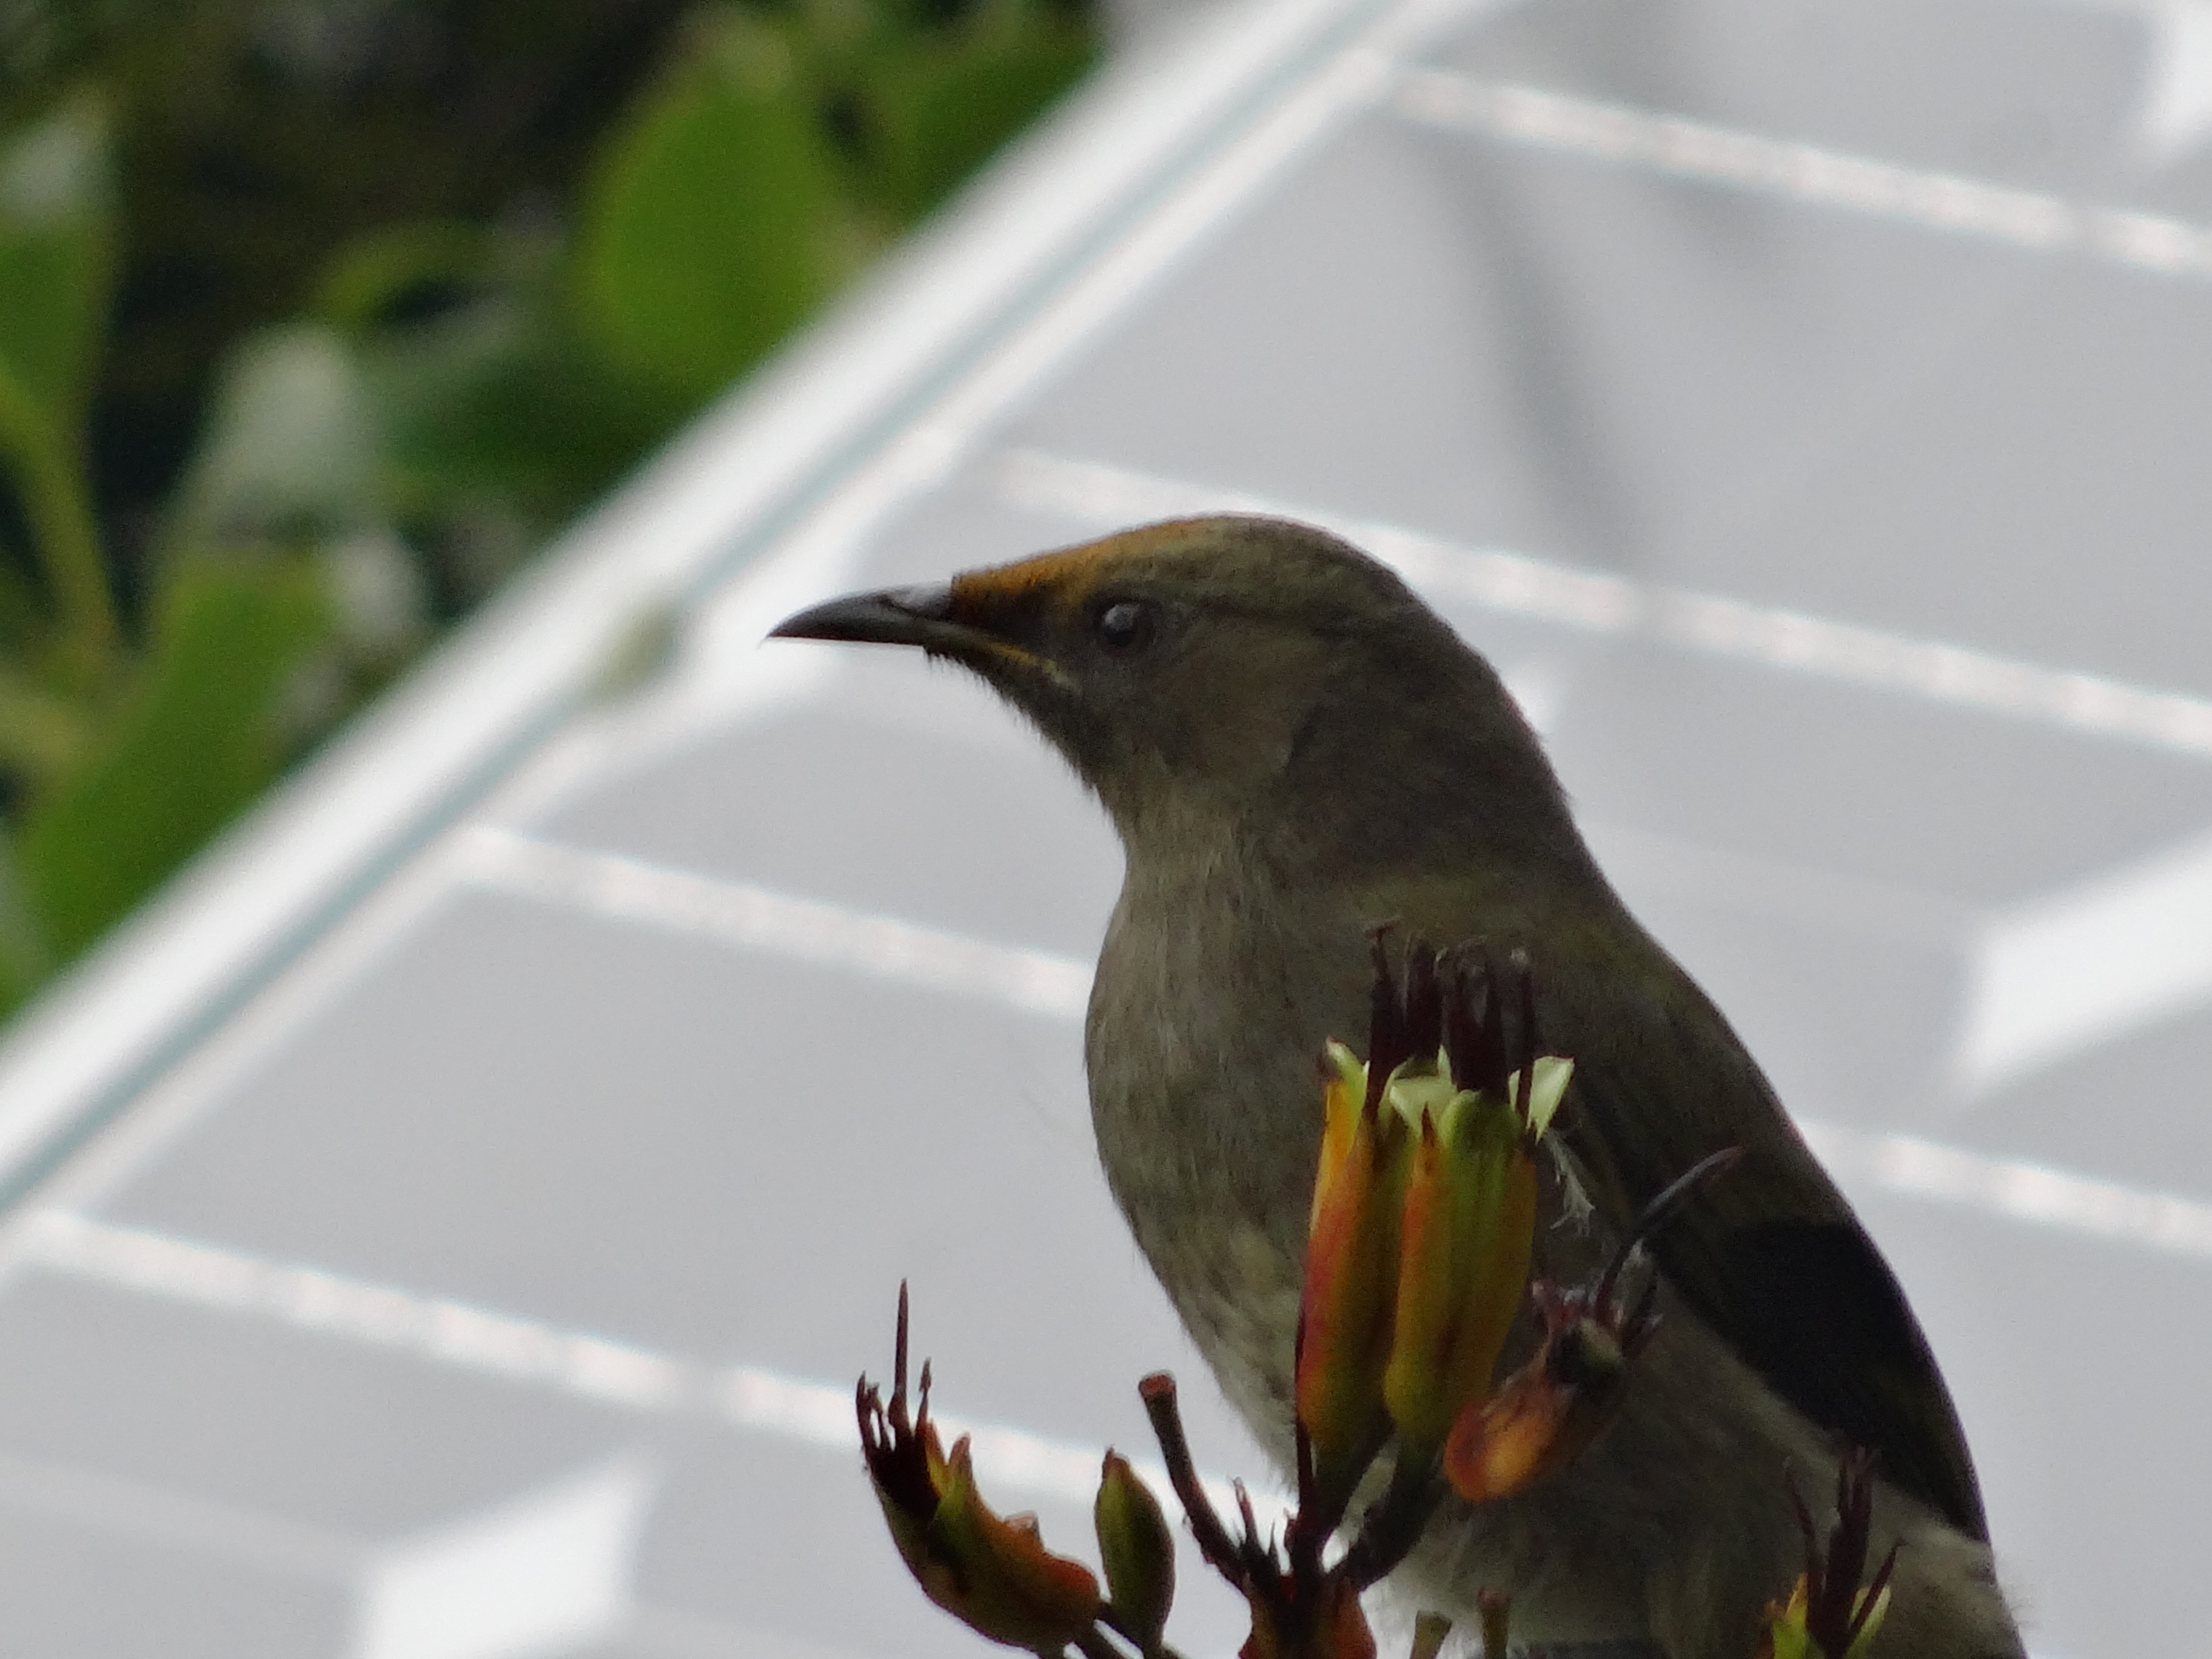
    Bellbirds(Anthornis melanura, koromiko)are commonly found in the South Island. These birds have a short, curved beak and are green with a slightly forked tail. Bellbirds, similar to Tūī’, have a distinctive song, it is like a high ringing that’s also kind of smooth, and the repeat the same tune. Bellbirds reside throughout native and exotic forest, scrubs and shelter belts of New Zealand. Their diet is nectar from native and exotic plants, although they do consume fruit in late summer and autumn. Also their diet consists of honeydew that’s found on beech trees.

    Bellbird

    Bellbird. Photo CC By Glenda Rees, Flickr

    Back to the study

    Jon Sullivan wanted to understand how nature responds to a forever changing world. He collected distribution and abundance information for many species with these three species being the focus. This is where the methods came into play as a standardised method and a repeatable one is needed to accurately tell us if a species is present or not. The methods talked about above were to work alongside each other.

    Around 100,000 bird counts were collected. The approach used helped to summarise data that was from one location, a certain time each week, and one daily route. The results showed that this approach was effective and just as effective as the 5 minute bird count. Counting birds while riding your bike along a road was just as effective at estimating and following trends as more traditional methods.

    Fantails, grey warblers, and bellbirds (but not to the same extent as the other 2) are majorly restricted to their forest biotopes and native plantings, particularly in spring.

    Like any good study, more data are needed to get a better and clearer understanding. This could create a good opportunity at Lincoln University to teach students doing ecology to learn how to use different techniques besides just the 5MBC methods. Then we too can collect decades long information on our favourite birds.

    This article was prepared by postgraduate student Caitlan Christmas, Masters of Science in Ecology and Conservation, for an assignment in ECOL608 Research Methods in Ecology.

    Sullivan,JJ(2012). Recording birds in real time: a convenient method for frequent bird recording https://researcharchive.lincoln.ac.nz/server/api/core/bitstreams/04dc8df3-2e34-4fe9-96a6-ea8a505ad0cc/content

  • Amaizing distribution: nematode infestations of NZ corn

    Amaizing distribution: nematode infestations of NZ corn

    Are your maize plants growing well in the field? If not,we can often blame plant parasitic nematodes.

    There are around 4100 known species of nematodes and they cause a considerable loss of agricultural produce, with estimated global crop damage of $US 358 billion every year.

    The life cycle of these plant parasitic nematodes have four stages, and the second-stage juvenile (J2) is the destructive phase. Most nematodes are sedentary inside the host and others survive in the soil.

    Written by Sambath in behavior, conservation, front page profile, invasive species, student blog, Uncategorized, zoology, pest management

    In the 2021/22 NZ growing season, about 196,000 tonnes of grain and 1,200,00 tonnes of silage were harvested, making maize one of the most cultivable crops in New Zealand. Around 58% of the harvest was grown for livestock feed demand, and the remaining 42% was for food and industrial processors.

    Plant parasitic nematodes are common in New Zealand and many horticulture industries have experienced a substantial loss of profits from these destructive plant pests. While maize is one of the most crucial crops in this country reported to be damaged by various species of nematodes, few studies have been conducted here compared to other countries.

    So, Nagarathanam Thiruchchelvan, a PhD student at Lincoln University, and his team conducted research to identify and quantify plant parasitic nematode infestations of maize production across New Zealand. Their purpose was to investigate the prevalence and diversity of several genera of plant parasitic nematodes.

    Plant parasitic nematode feeding types. Image from Paulo Vieira & Cynthia Gleason

    The researchers collected a total of 384 composite soil samples from 25 maize fields located in the North and South Islands, focusing on: Canterbury, Waikato, and Manawatu-Whanganui. Data collection was carried out at various maize growing stages and seasons during 2022.

    It was not good news!

    The researchers found that at least one genus of plant parasitic nematode was detected in 378 (98%) of the maize samples. Pratylenchus was the most prevalent and widespread genus (91%) followed by Helicotylenchus (38%).

    Plant parasitic nematode. Image from Scot Nelson

    The plant parasitic nematode population and diversity were higher in Canterbury than in Waikato and Manawatu-Whanganui. Thiru and his team believed that the inconsistent distribution was caused by different climate and geography conditions between the two regions. For example, the South Island is more diverse in soil physiochemical proportions than the North Island.

    Thiru also observed that soil orders, a soil classification system, affected the proliferation of plant parasitic nematode populations, with brown and pallic soil types promoting nematode reproduction, especially for Pratylenchus. Pallic soils refer to a soil type having pale, fragile topsoil and compacted subsurface. For the brown soil, its topsoil is dark grey-brown, and the subsoil is tan or yellowish-brown.

    The lowest number of plant parasitic nematodes was detected in organic soil. Organic-rich soils favor a wide range of beneficial fungi, bacteria, and nematode survival. These microorganisms can suppress the proliferation of plant parasitic nematodes by either feeding on eggs or predating invasive nematodes.

    The study further indicated that the population and diversity of plant parasitic nematodes increased alongside distinguishing developmental stages of maize. Most nematodes were reported from the harvesting stage, while the least were from the seedling stage.

    Root-knot nematode (Meloidogyne enterolobii). Image from Jeffrey W

    Thiru and his team noticed that rotating maize with other crops played a significant role in reducing the incidence and prevalence of plant parasitic nematodes in the field. These other crops included ryegrass, pasture, wheat, white clover, potato, peas, and winter crops. One maize field located in Canterbury was detected with a high significant intensity of 3000 nematode root lesions per kg of roots as a result of non-rotation practice.

    Thiru concluded that there was a requirement for a deeper understanding of dispersal, feeding characters, and life cycle of plant parasitic nematodes, in particular, root-lesion nematode (Pratylenchus) in maize fields across New Zealand. Specific pest management approaches are needed to control the prevalence and abundance of targeted nematodes impairing maize production in both islands.

    These article was prepared by Sambath Seng, a Master of Science student in the Department of Pest Management and Conservation at Lincoln University.

    Thiruchchelvan, N., Kularathna, M., Moukarzel, R., Casonato, S., & Condron, L. M. (2024). Prevalence and abundance of plant-parasitic nematodes in New Zealand maize fields: effects of territory, soil orders, crop stage, and sampling time. New Zealand Journal of Zoology, 1-22. https://doi.org/10.1080/03014223.2024.2424900

  • Silent hunters on the wetland edge: urban cats and nature conservation

    Silent hunters on the wetland edge: urban cats and nature conservation

    The dark side of the cat

    A cat carrying a bird in its mouth while another cat observes nearby, set in a garden with stone pathways and decorative animal statues.
    Cats doing what cats do.
    Photo by Robert | Visual Diary | Berlin on Unsplash

    In the autumn evening, a cat lies on the fence, with focused eyes and slightly wagging tail, this patient hunter is quietly locking onto a target and preparing to attack.

    Cats are the standard feature in almost neighbourhoods in New Zealand. They are elegant, lazy, affectionate, and sometimes unpredictable. Some of them are pretty welcomed , moving freely around neighbourhoods everyday, accepting feeding and petting.

    Behind these soft furs and friendlypurring, there is an ancient, untamed instinct hidden – hunting. Hunting is not just about hunger. Most cats were are well-fed—some are even fed multiple times a day. Yet, the urge to stalk, chase, and kill remains.

    Travis Wetland: A natural island in the city

    Wetlands, green spaces, and bushes are the last shelter for local plants and animals. These “ecological islands” are often located right next to the communities where we live.

    Travis Wetland is a freshwater ecological oasis, located on the edge of Christchurch. Surrounded by residential areas, roads, and commercial development, it remains a vital refuge for more than 53 species of birds and many native invertebrates.

    Living around this wetland, there are hundreds of free-moving domestic cats living. They can walk through the grass without permission, quietly enter the ecological core area, and become hunters of these small lives.

    A sleek black cat crouches on a wooden fence, focused with its golden eyes, poised as if ready to pounce, surrounded by lush green foliage.
    A Patient Hunter
    Photo by Kristin O Karlsen on Unsplash

    Silent pressure & hidden trail

    It is easy for people to imagine a cat lazily lying in the sun by a windowsill, but what about the other side of their life when they step out the door?

    Over the course of a year, 21 pet cats living near Travis Wetland were installed with GPS collars as part of a study by Lincoln University and the Christchurch City Council. The research, led in part by Shelley Morgan and Adrian Paterson, revealed some surprising results.

    Researchers did not capture many cats with prey in their mouths (although more than a few did bring their prey back to their home). But there were other situations: cats were often visiting the edge of the ecological core of the wetland, where native birds, lizards and insects breed.

    A close-up of a small bird with dark brown feathers and a distinctive long tail, perched on a log in a green and grassy environment.
    Fantail(Rhipidura fuliginosa)
    Photo by Callum Hill on Unsplash

    The cat threat does not necessarily come from killing, sometimes, just “attending” is enough. Birds may abandon their nests if they sense a nearby predator. Lizards may interrupt their mating if they feel targeted. In nature, energy is precious, and fear itself is also consumes energy.

    More than half of the monitored cats entered Travis wetland at least once. Some of them went more than 200 metres into the wetland while their owners sleeping, crossing habitats and breeding areas for rare native lizards, insects and ground-nesting birds.

    More than half of the monitored cats entered Travis Wetland at least once. Some of them went more than 200 metres into the wetland while their owners sleeping, crossing habitats and breeding areas for rare native lizards, insects and ground-nesting birds.

    But not every cat causes the same amount of harm.The study found that younger cats—those under six years old—were more active and risky. They travelled further, spent longer inside the wetland, and brought home more prey. Some even swam across water to reach nesting islands. In contrast, older cats tended to stay near home and moved less.

    A small number of energetic cats were doing most of the damage. Researchers called them “super-predators”. This suggests that cat behaviour and age both matter. While most cats seem harmless, a few individuals can quietly cause serious impacts to local wildlife.

    This means the cat you see curled up by the fireplace in the afternoon may be walking the narrow line between urban life and ecological harm at night. It’s not the cat’s fault, and it’s not your fault, but it’s keep happening.

    A cat with black and white fur is sitting behind a window screen, looking outside. The window frame is made of weathered wood, giving a rustic feel to the scene.
    Cat by the Window
    Photo by Aleksandar Popovski on Unsplash

    Night walkers & tiny bells

    Cats are typical “crepuscular” animals, that is, they are most active in the dawn and dusk. This explains why you see cats running around the living room at 10 pm or staring at the wall at 5 am. They don’t listen to a clock, they listen to the call of instinct.

    Sunset and just after is also the time when many cats go out for their “night patrols”. According to the data from the study’s cat GPS tracking, cats move more frequently and walk farther at night. Some cats hardly go out during the day, only sneaking through the garden and visiting the fields after dark.

    So, what can we do to reduce the impact of out furry friends? Some owners hang small bells on their cats’ collars, hoping that the sound will alert potential prey and give them time to escape. This method seems simple and effective, but the effect actually varies from species to species.

    There is a study by University of Otago have shown that bells have a certain deterrent effect on birds and the study by Geiger shown that have little effect on lizards or insects because they are not sensitive to sound. Also some smart cats can even learn to “walk silently” – so that the bell doesn’t ring at all.

    A black cat peeking from behind a concrete structure, with one green eye visible and a blurred background showing hints of light.
    Nightwalker Cat
    Photo by amir esfahanian on Unsplash

    So, while bells may help a little, they are not a panacea. As with everything in this story, the answers are never simple.

    Draw a ceasefire zone

    Some solutions are simple, and others need some creativity.

    In some parts of New Zealand, there is talk of creating a cat-isolation buffer zones — areas around nature reserves where cats are either required to be kept indoors full-time, or where cats are banned or a curfew(Wellington City Council. 2024) is imposed on cats near reserves (although curfews seem not work for protecting birds or lizards)

    This idea is not to punish cat owners but to protect the most vulnerable parts of the ecosystem. Because may be the problem is that house cats may be found curled up in warm blankets, purring softly, eyes half-closed, and when just hours earlier, those paws may have landed a fatal blow on a small bird, or pinned a native skink to the ground.

    Free-roaming cats in New Zealand are subject to different local management depending on their relationship with humans (such as companion cats, stray cats, and wild cats), but there is currently a lack of unified national laws(Sumner, C. L. 2022).

    Threatened-Nationally Critical Skink: Alborn Skinks(Oligosoma albornense)
    Photo by James Reardon

    Some newly built areas even state in the purchase agreement that cats are not allowed to roam freely, and sometimes even completely prohibit cats(Preston, N. 2023).

    To some people, such regulations may sounds really extreme. But to naturalists, it is a way of respecting boundaries, a quiet commitment to leave even a small area and keep distance for the creatures that have lived here long before we came here.

    We would much rather have this scenario: ‘In the autumn evening, a cat looks out of a window at a fence, with focused eyes and slightly wagging tail, this patient hunter is quietly locking onto a target that it would love to attack. Frustrated, it curls up and goes back to sleep.’

    This article was prepared by Master of Pest Management  postgraduate student Linfeng Yu as part of the ECOL608 Research Methods in Ecology course.

    Research paper: Morgan, S. A., Hansen, C. M., Ross, J. G., Hickling, G. J., Ogilvie, S. C., & Paterson, A. M. (2009). Urban cat (Felis catus) movement and predation activity associated with a wetland reserve in New Zealand. Wildlife Research, 36(7), 574–580. https://doi.org/10.1071/WR09023

    References

    Geiger, M., Kistler, C., Mattmann, P., Jenni, L., Hegglin, D., & Bontadina, F. (2022). Colorful Collar-Covers and Bells Reduce Wildlife Predation by Domestic Cats in a Continental European Setting. Frontiers in Ecology and Evolution, 10. https://doi.org/10.3389/fevo.2022.850442

    Housing development near Auckland imposes cat ban to protect wildlife. (n.d.). 1News. Retrieved 5 May 2025, from https://www.1news.co.nz/2021/08/11/housing-development-near-auckland-imposes-cat-ban-to-protect-wildlife/

    Preston, N. (2023, July 1). No cats allowed: Growing number of new neighbourhoods banning pets. Oneroof. https://www.oneroof.co.nz/news/no-cats-allowed-growing-number-of-new-neighbourhoods-banning-pets-43855


    Responsible cat ownership. (2024, October 17). Wellington City Council. https://wellington.govt.nz/dogs-and-other-animals/cats/responsible-cat-ownership


    Sumner, C. L., Walker, J. K., & Dale, A. R. (2022). The Implications of Policies on the Welfare of Free-Roaming Cats in New Zealand. Animals, 12(3), Article 3. https://doi.org/10.3390/ani12030237